Logging in Microservices: A developer's journey

Hey! I am a software engineer by profession. Passionate about Ruby, Database internals, optimization, distributed systems
As software engineers, logs are our best friend for finding anything right/wrong with our services. Be it exception tracing, RCA for a bug, consumer claims, or user journey, logs are the tool to trace it. Yet, I feel as software engineers, we do not pay much attention to log management while developing applications (right from putting them into application code properly in the first place). This article is not about the best tools you can have for log management for your application but some stuff that you can keep in mind for having the right log management for your application.
An ideal log may look like:
log(level: “error”, trace_id: “”, message: “Custom error message with context”, data: {“host-name”: “”, “host-ip”: “”, “contextual-key”: “contextual-value”}, timestamp: “”, stacktrace: “”)
Why a proper logging is needed?
Well, first and foremost we all make mistakes. Having a logging system with stack trace, log levels, contextual data, and errors (if any) can help us identify an issue in no time.
It is great for collaboration and having to work with multiple team members (unless you wanna remain the forever on-call person 😛). It’s helpful for a new person who gets onboarded to your service to understand the errors/context easily.
Logs help in tracking your user journey and identifying issues. (P.S. You can set up alerting and monitoring on top of your logs/some log patterns too. I have done it in the past and it was super helpful.)
Logs delivery (Where can you store your logs?)
Console output — Very common and basic logging strategy for debugging. This is very simple and easy to use and handy when developing an application. Cons — logs won’t persist after the console is closed.
File write — Your application can keep writing logs to a file, and so the log events will be stored on a local disk. And they’ll persist even if you close the console. However one issue that it may lead to is fast utilization of disk space on your application server.
HTTP — You can make an HTTP call to your log service with the log payload and it’s up to the log service to process and store it the way it wants (well, the way it’s configured rather 😅). But this leads to a whole new set of issues, i.e delay in application response time. If you add too many logs to your application and it makes a synchronous HTTP call to log service every time, it’ll add a lot of delay in your application response time because of HTTP encryption/decryption/authentication/acknowledgment (and who doesn’t want a faster response time for their application).
▹ Solution — Make asynchronous calls. Yes, I’m coming to the downside for this too, don’t be judgemental so soon. Making asynchronous calls on a separate thread to the log service does solve one problem of delay in application response time. But, what about retries? What if your async HTTP call to log service fails and your application crashes too! Imagine having to debug the cause of the application crash when your error logging call failed too :(.
You can go for a hybrid approach, wherein for the severe logs, you make sync calls to log service (ERROR level log for e.g.) and for debug/verbose you can make async calls.Queueing — You can push log messages to a queue and they can be processed later, in batches or as single events, like a Kafka streaming platform. You can build a retry mechanism on top of it too.
You may go for a combination of these depending upon the requirements. For e.g. can write logs to a local disk and other software reading that file at frequent intervals and push it to the log service (something like logRotate).
Some tips
Add a uniform source ID especially if you’re working with microservices. What that means is you generate a request ID/UUID for a new request that comes from the client and you tag all the logs that are generated across different microservices throughout this request lifecycle with this unique id. This comes in handy when you want to track the user behavior/abnormality across microservices.
Always add log severity very literally to the context of why you’ve added a particular log. There are 4 log levels, DEBUG, INFO, WARNING, and ERROR. One common mistake people make is adding everything to an INFO level log. Adding logs without the proper level may lead to chaos and you may not find the actual log that you’re looking for in times of crisis.
Make sure to add timestamp at the application level to track the exact timestamp of the event. If you add timestamp of log entry, it may not respresent the actual timestamp of event as there could be some delay in log registration.
Find a tool for centralizing your logs.
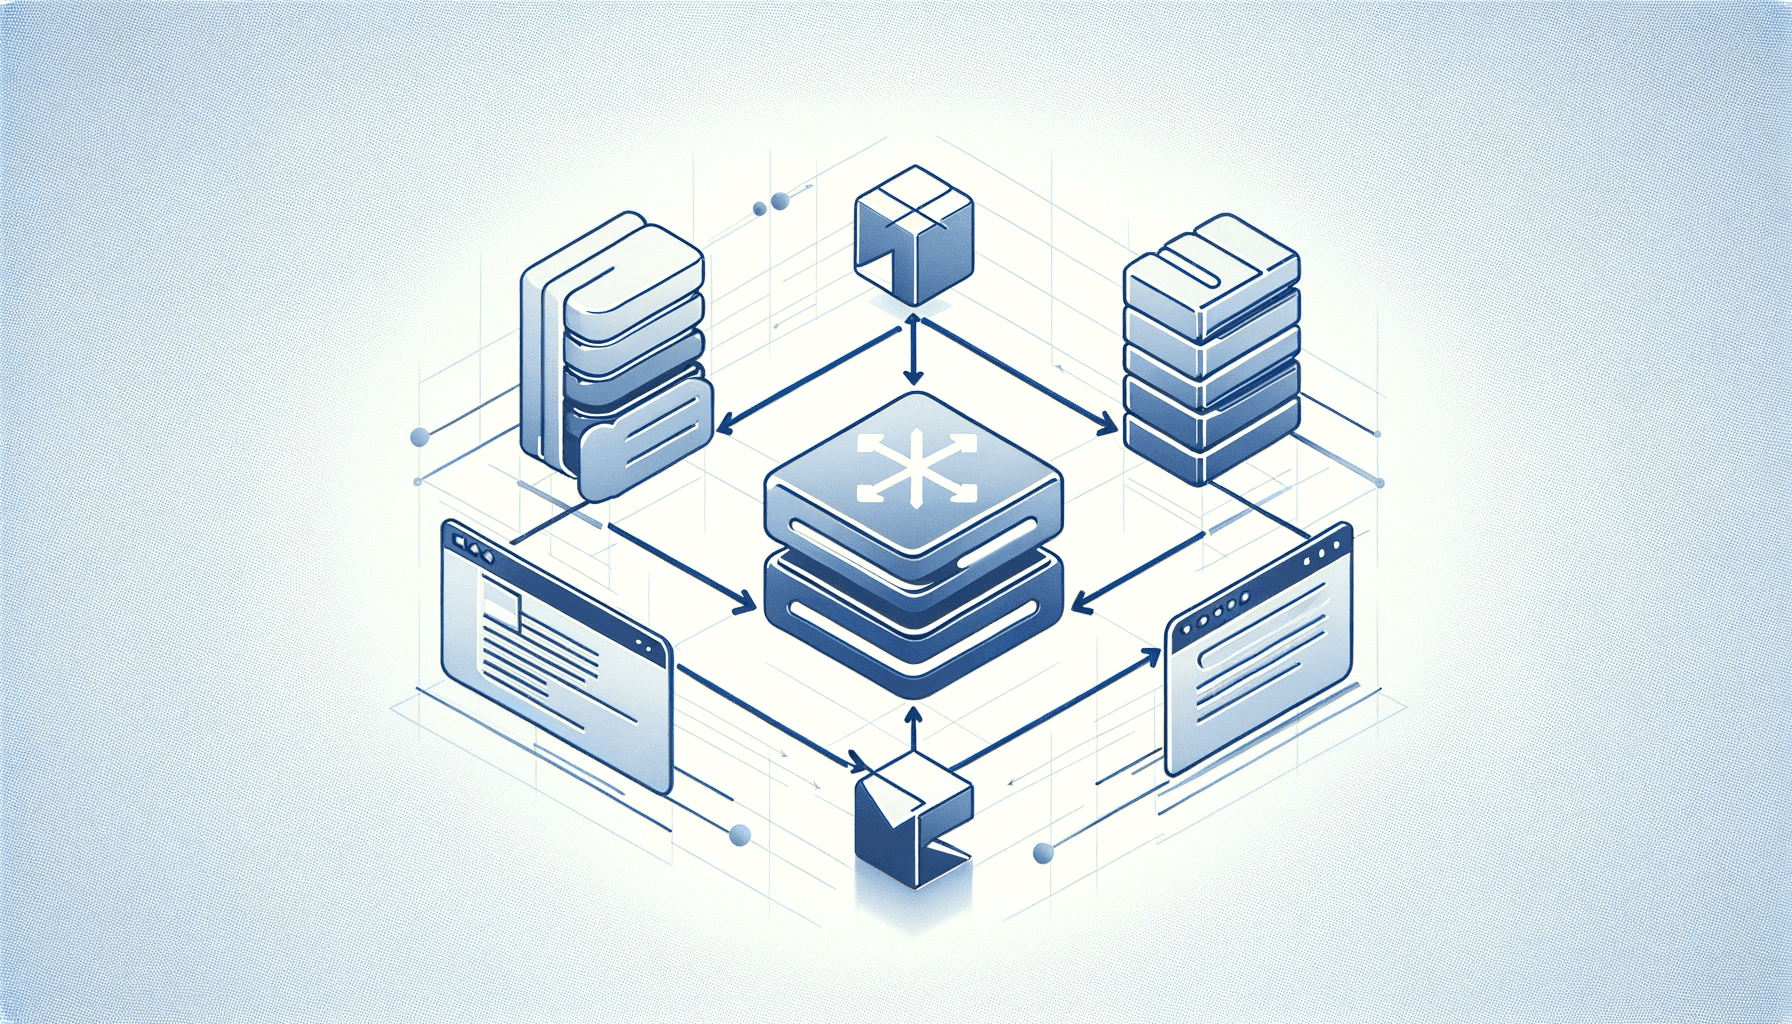
▹ If you’re working with distributed systems, you’ll likely have logs on different servers, which may be spread across different microservices, and fragmented. Having a centralized tool is very helpful for monitoring and troubleshooting issues in a certain time period.
▹ Look out for tools that allow you to filter, query, index, and search data according to your needs because you cannot always work with plain text logs.
▹ Check support for multiline logs. If you have stored stack traces in error logs and your logging software treats each line as a separate log, it becomes super confusing to look at.Don’t forget to remove business info-related logs while creating a release build.
Really, in the end, it should be you deciding what to use for your application. There’s no need to over-engineer your logging system (any software actually 😅)if your system doesn’t have the requirement for that.


